Bdeo · B2B SaaS · 7 min read
Claims management dashboard · Bdeo
−33% time per claim · 5 enterprise clients on schedule
Case study by Vicente Molero, Senior Product Designer.
Overview
Bdeo · B2B SaaS
When the problem wasn’t what it looked like
The brief was to improve the dashboard. What we found was different: adjusters ignored the AI alerts because the system was never designed around their real workflow.
In 30 seconds
In 30 seconds
- Problem
- Adjusters at large insurers ignored the AI alerts, including the fraud ones, and used the dashboard only to look at the photos.
- My role
- I co-designed the product with another designer. I owned the information architecture and the components, which became the foundation of Ethos, Bdeo’s design system.
- Result
- −33% review time per claim in production, 50% more capacity per adjuster, and 5 enterprise clients on schedule.
- Role
- Senior Product Designer
- Duration
- 6 months
- Team
- 2 designers, 1 PM and engineering
- Context
- Claims management dashboard for large insurers. Enterprise B2B product in production, with real clients who weren’t using the main feature.
Impact
- −33% Review time per claim — 7.8 → 5.2 min in production: 50% more claims per adjuster. For some clients, −50%.
- 5 Enterprise clients on schedule — Business OKR met.
- 1 A shared multi-client base — The origin of Ethos, Bdeo’s design system.
The feedback has been extremely positive and they can’t wait to switch. In sandbox simulations, one of their assessor team leads timed himself reviewing a claim: he went from 12 minutes on average with the old dashboard to 6 with the new one. A 50% time reduction.
The problem
An external team built the MVP without any user research. It worked and had real clients in production, but adjusters didn’t use the alerts: the AI system generated them automatically and its main users ignored them. Among them were the potential-fraud alerts, the ones an insurer values most.
The problem lay in how adjusters worked rather than in the interface. So we decided to understand their real workflow before designing anything.
I don’t use the current alerts. They don’t match the ones I need to read and I can’t easily spot them on the screen.
Research
Some stakeholders questioned delaying design to do research. We stood our ground: without understanding the real workflow, we’d be optimising on assumptions. Bdeo backed the approach to the point of training us in research before we started. It was the company’s first project built this way, and the method was later repeated on others, such as the mobile claims flow.
- +8h recorded interviews with adjusters at large insurers
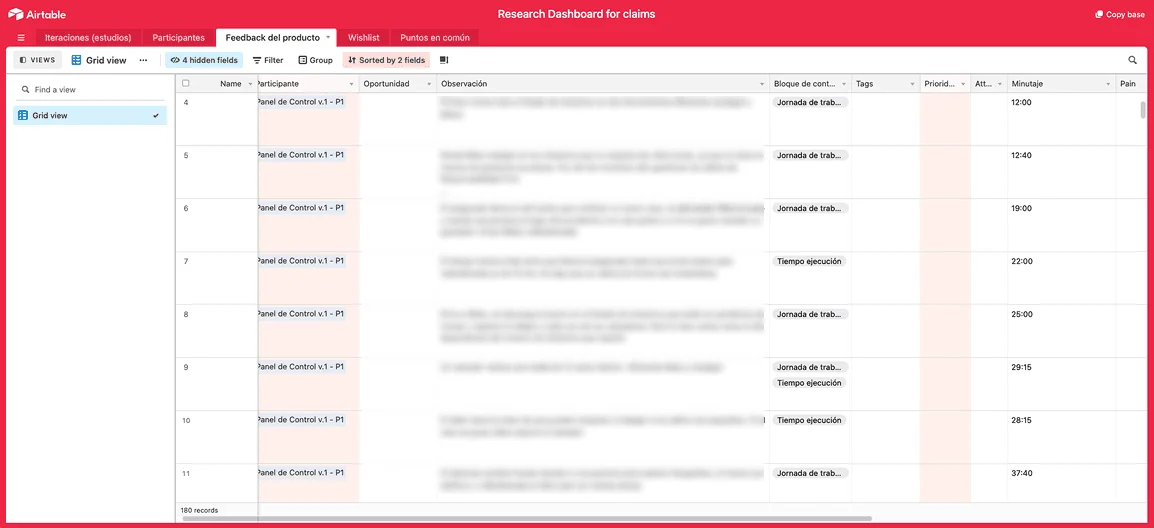
- 180+ insights extracted and tagged in Airtable
- ×3 methods per session: journey · shadowing · card sorting
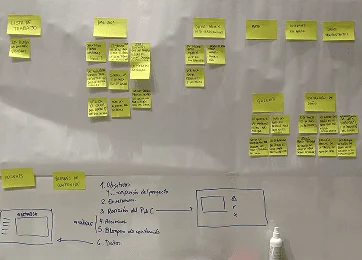
- Shadowing was the turning point. Watching an adjuster work live showed that the dashboard was a secondary stop in their day. They looked the claim up in another system, validated it by vehicle type, and only came into Bdeo for the images.
- The alerts went unused because they didn’t match the operational workflow and were hard to spot visually.
- What they needed first: VIN, licence plate, make, model, policy number and claim file. None of it was prioritised.
- The AI masks over the images, the product’s visual showcase, made it harder to assess the real damage for the adjuster.
- There wasn’t a single way of reviewing. Depending on the client and the type of claim, some reviewed the full case and others only the images.
Decisions
Five moments where the right decision wasn’t the obvious one.
Ordering the product the way the adjuster decides
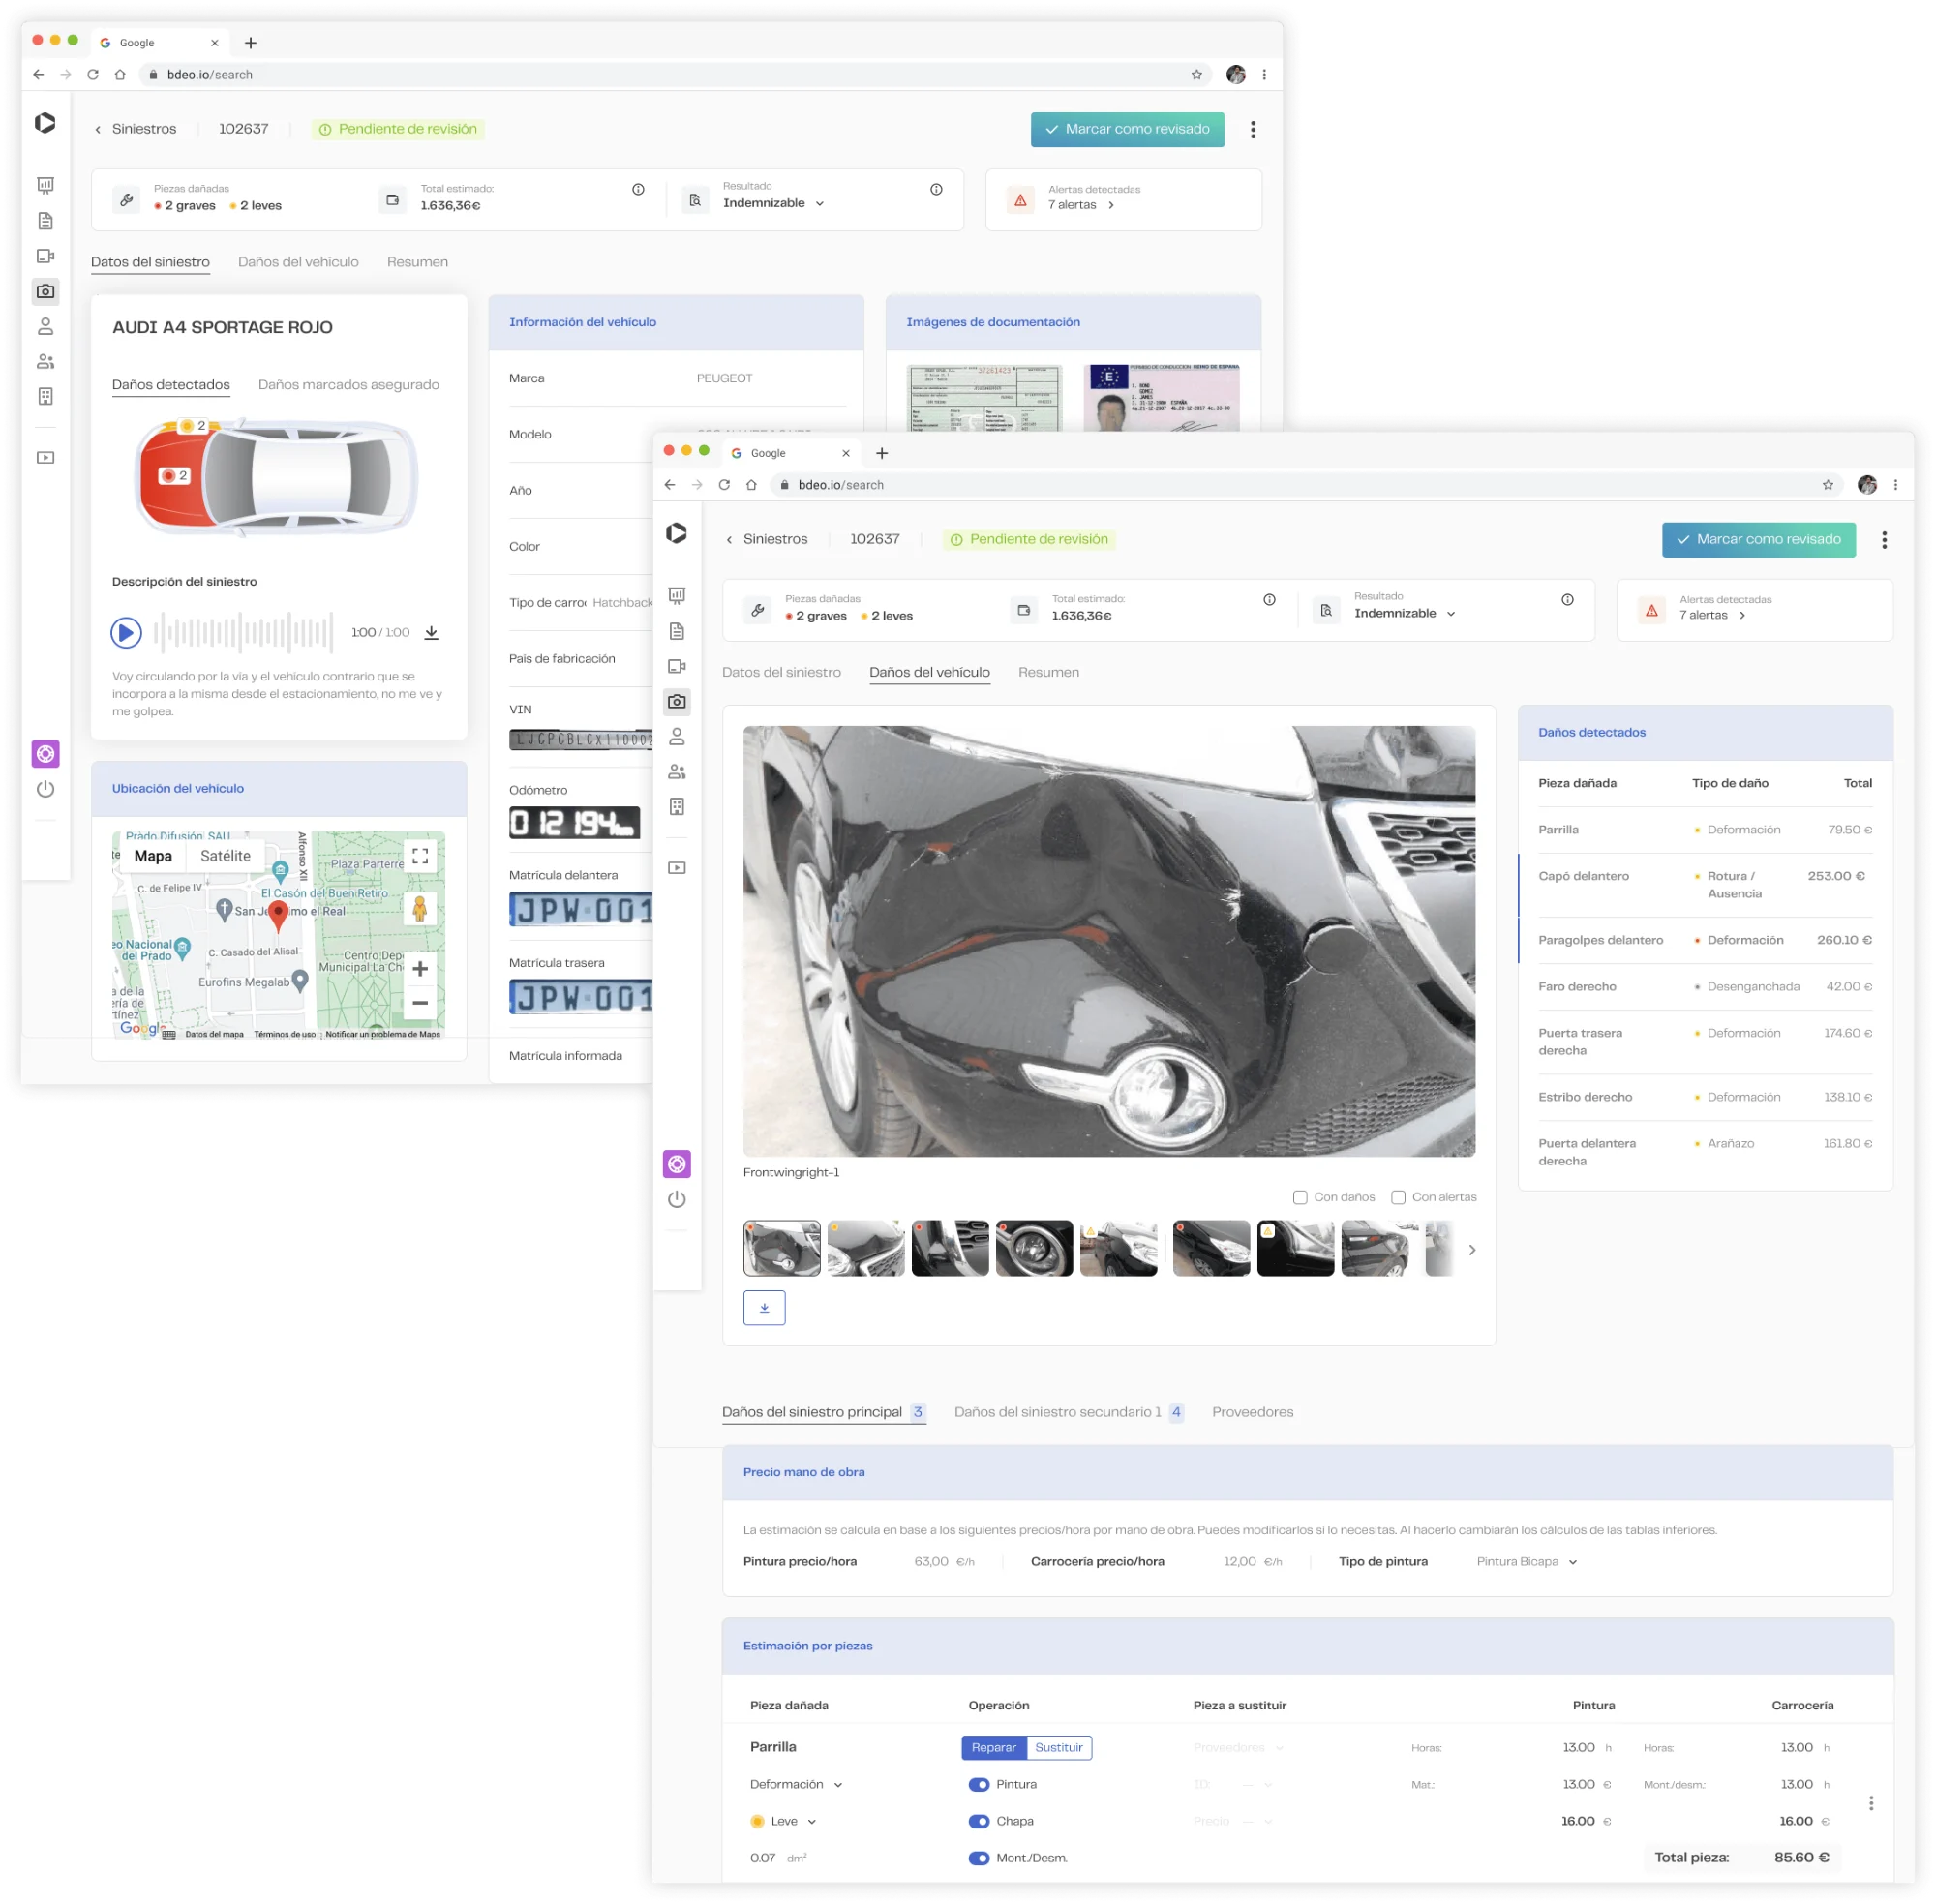
The MVP showed information in the order the system generated it. An adjuster decides in a different order: first they confirm the vehicle, then they assess the damage and finally they close the report. I redesigned the information architecture around that journey, with the data they need first (VIN, licence plate, policy, claim file) at the very top. And since not everyone reviews the same way, the journey adapts to the type of review: full case or images only.
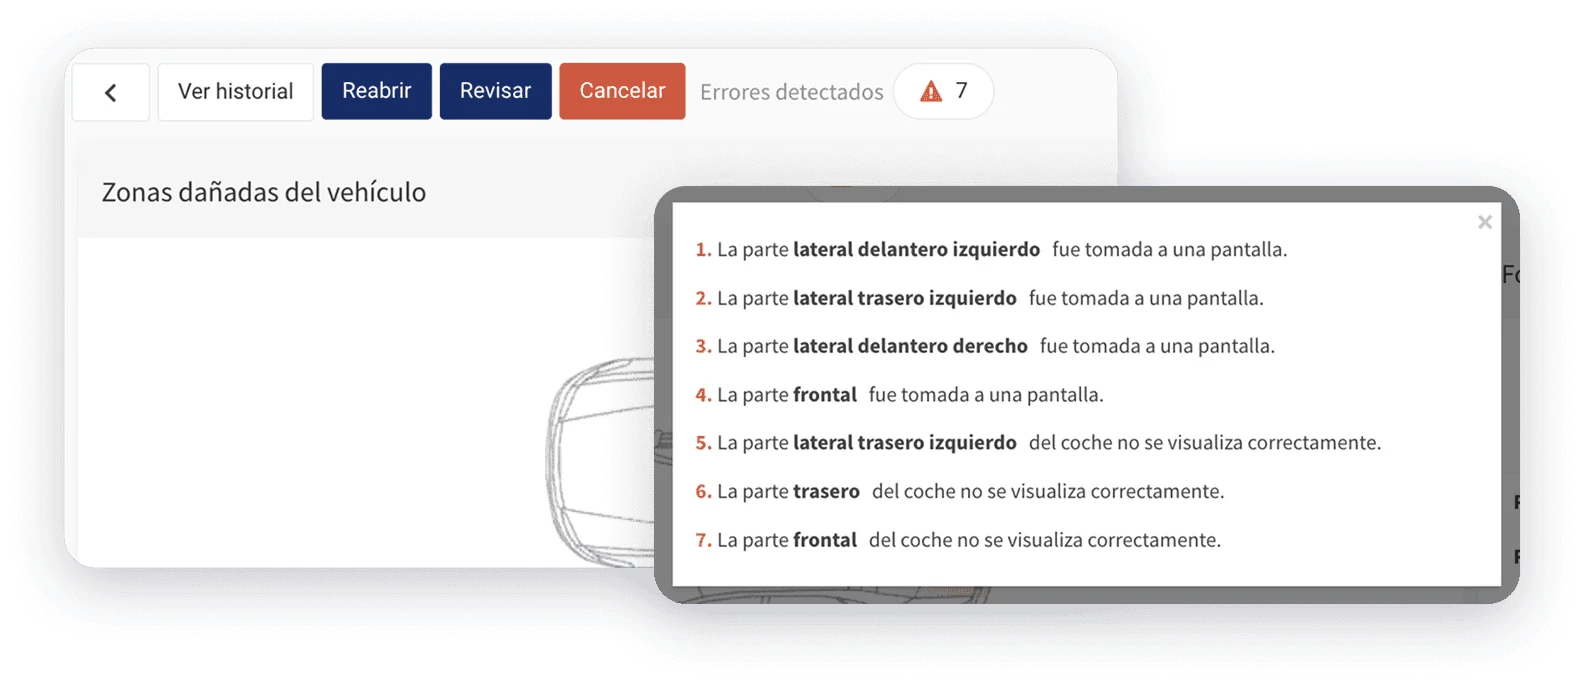
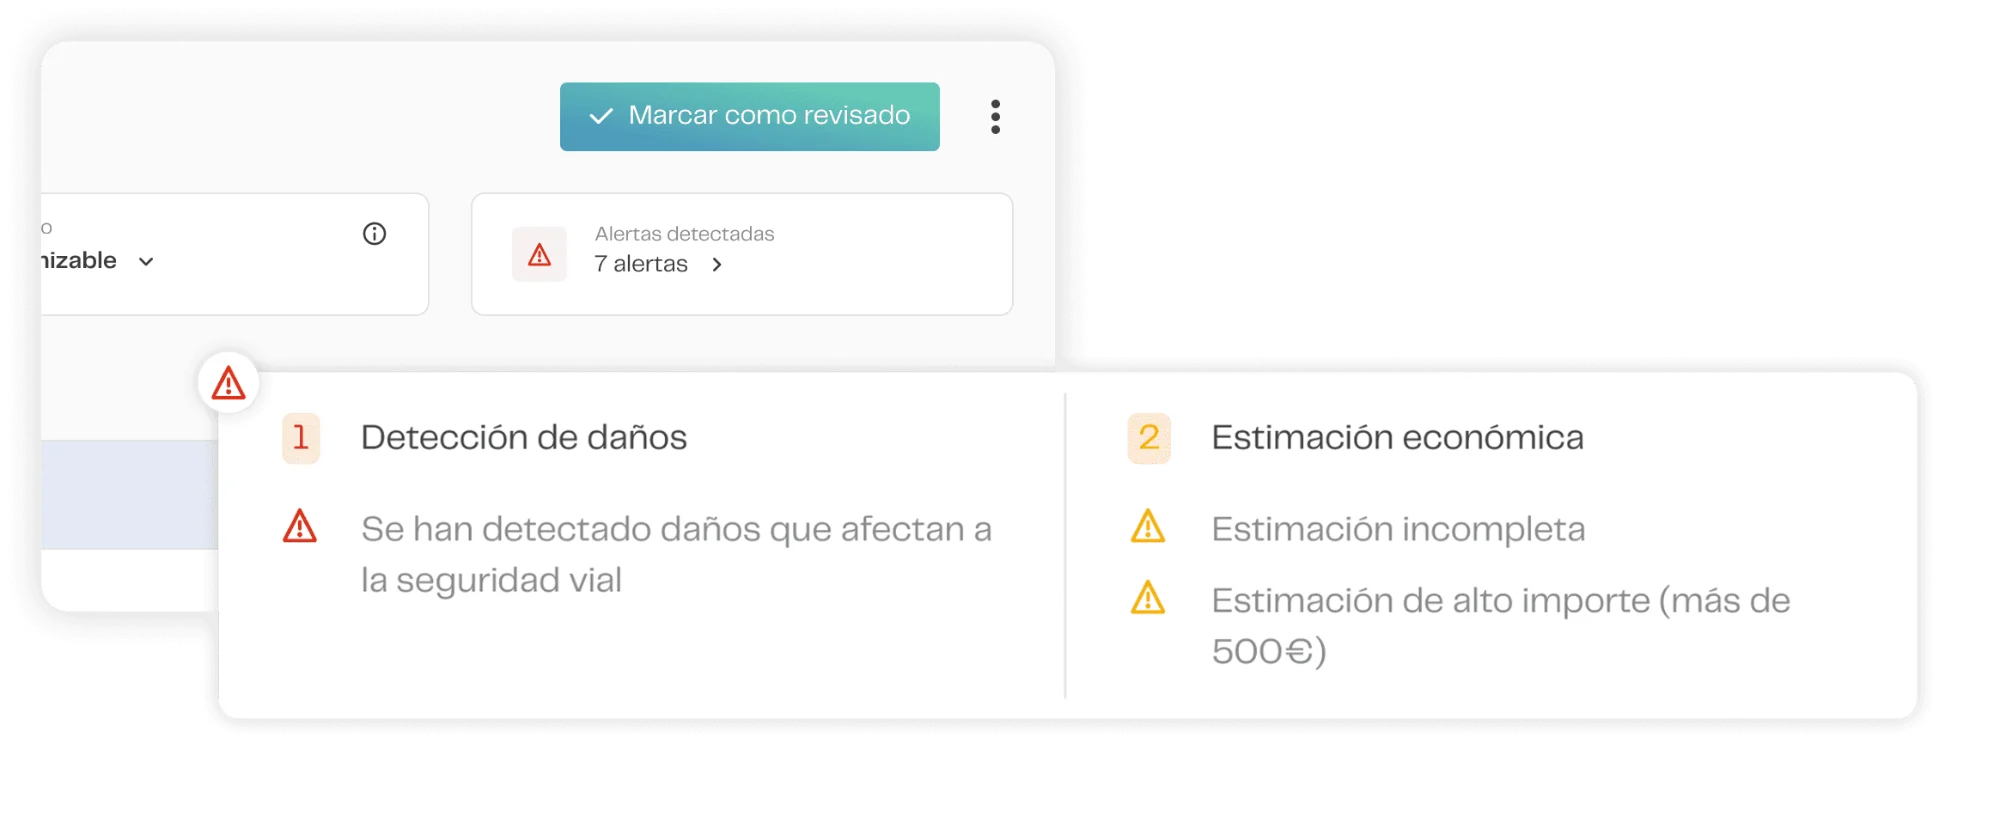
- Decision first. Status, result and alerts pinned at the top. The verdict is read before reviewing.
- Evidence next to the data. Each image and its detected damage are seen and selected together.
- One main action. “Mark as reviewed” as the only CTA. Destructive actions leave the foreground.
Result: The dashboard stopped being a secondary stop and became where the claim gets resolved.
Removing alerts the business defended
We proposed removing several alerts. The pushback was immediate: “clients asked for them; if we remove them, there will be complaints.” Our argument was simple: adjusters weren’t using them. We had recordings, we had data. We reorganised them, prioritised them and removed the ones that made no operational sense. The criterion was documented behaviour.
Result: The ones that stayed now appear next to the data they affect, across the whole interface. Clicks grew almost fourfold (+267%) from a base that was practically zero.
The AI masks: when the showcase gets in the way of the work
The masks were the visual proof of Bdeo’s technological value. The AI team defended them because they were their work made visible. Research showed adjusters ignored them when assessing damage. We didn’t remove them: we made them optional and designed a comparison mode that gave the user control. Giving that control increased the product’s value.
Result: The adjuster decides when to see the AI, instead of always having it on top.
Every adjuster correction teaches the model
Data didn’t just want the masks to be visible: they wanted to learn from what the adjuster corrects. We designed the damage table so that every edit was complete and structured, ready for the model to learn from. It’s already working in production: adjusters’ corrections are used to improve the AI.
Result: Human review stopped being just a cost and started improving the AI.
Consistency in a multi-tenant product prone to fragmenting
Bdeo runs very different configurations for each client. The pressure was to keep that fragmentation. Carrying on with separate versions per client didn’t scale, piled up debt and fragmented the design team’s judgement, so we ruled it out. We did the opposite: identify a solid common base and treat the variable modules as layers on top. Some stakeholders gave up customisations they considered essential. I designed the components of that common base, which were the origin of Ethos, Bdeo’s design system. Engineering used the change to renew how the product was built, which later made it possible to ship features faster.
Result: A product that scales without piling up design debt.
How we aligned
How we aligned
This project wasn’t decided in design alone. Every area had something at stake:
| Area | What worried them | How we solved it |
|---|---|---|
| Sales | Losing alerts clients had asked for | Recordings and usage data |
| AI team | The masks no longer being visible | Optional, with a comparison mode |
| Data | Learning from adjusters’ corrections | Damage table designed as data |
| Engineering | Renewing how the product was built | Shared base and new stack |
What I left alone
Not everything needed intervention. Part of the work was deciding where not to step in.
I kept the views that already worked in production, because replacing them without evidence would only have added noise. I prioritised the main flow over the exceptions. The AI masks stayed, but now the adjuster controls them. And I didn’t force visual consistency where behaviour didn’t call for it.
Process
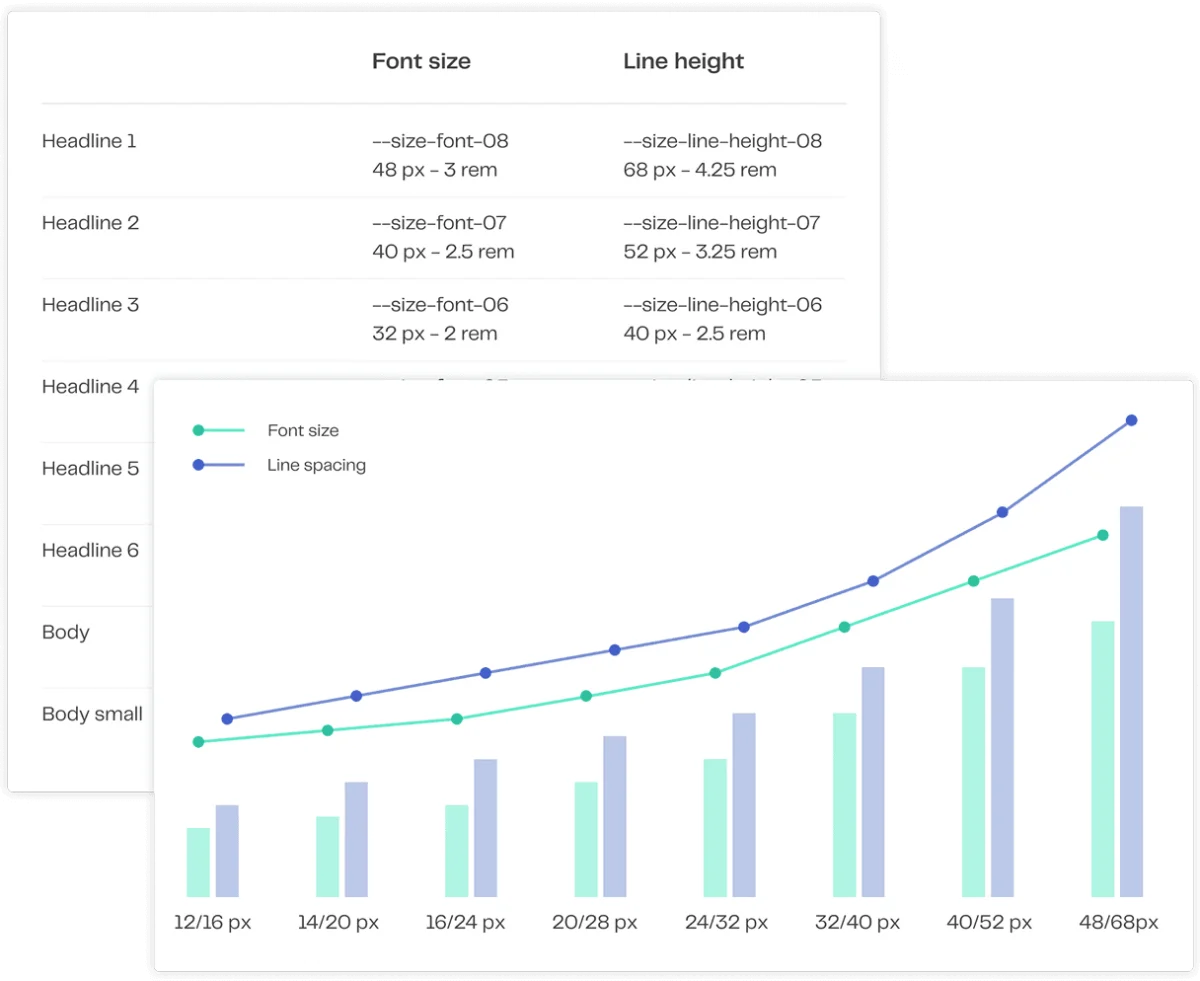
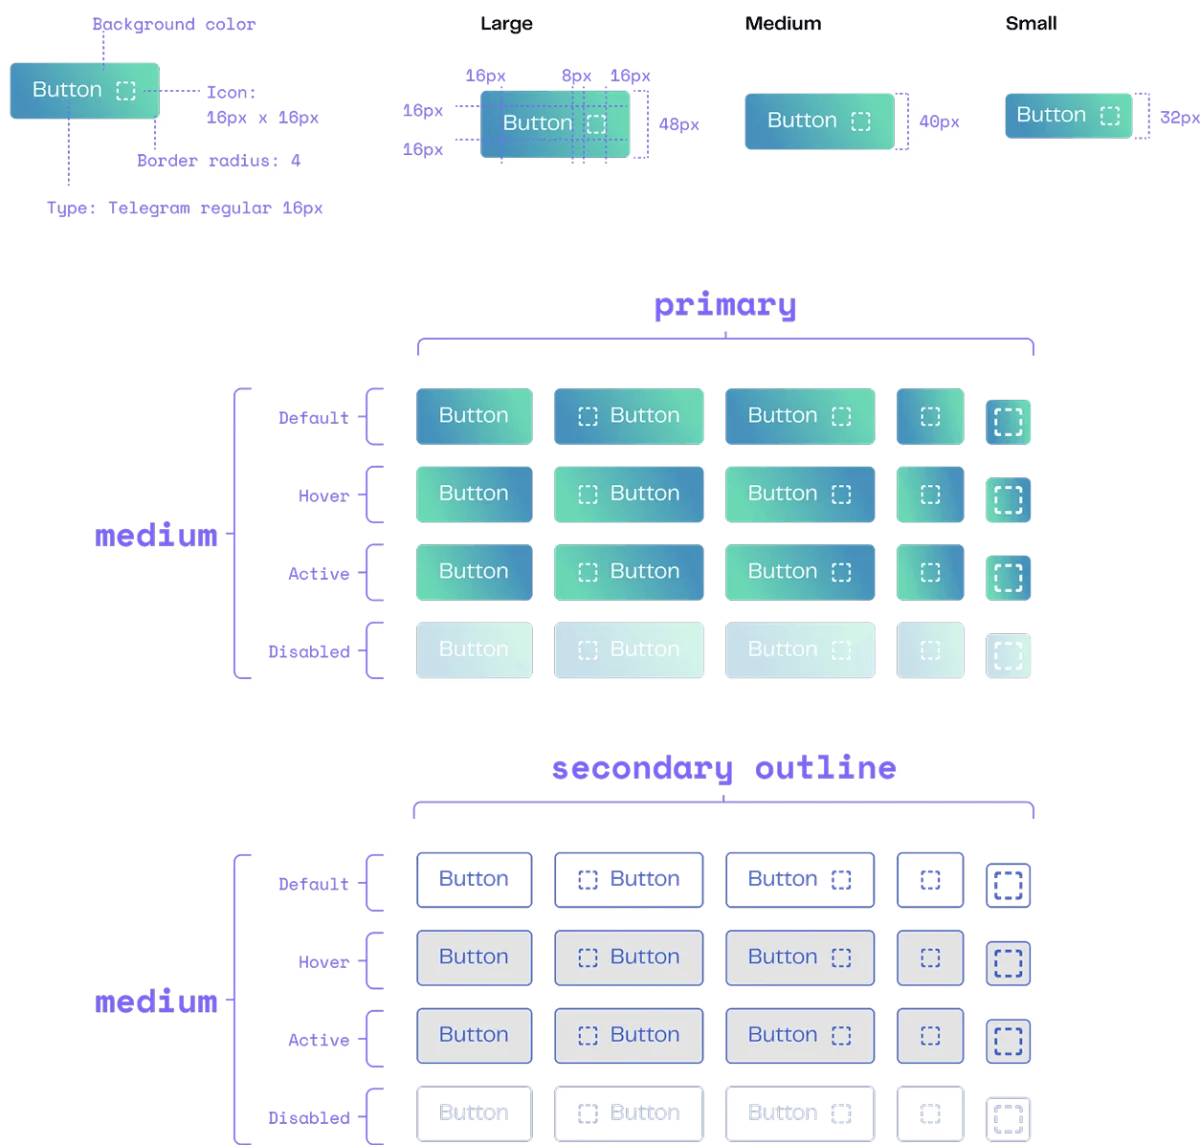
With the findings consolidated, we worked in five phases. We soon ruled out a step-by-step flow: there were several review journeys and a linear wizard fitted none of them. Prototype validation revealed another problem: adjusters forgot to save when editing card by card, so we redesigned the saving pattern before launch. The components I designed in this phase became the foundation of Ethos.
- Information architecture
- Low-fidelity wireframes
- High-fidelity wireframes
- Prototype validation
- Design system components
Learnings
- Business complexity doesn’t disappear; what you decide is where it lives. Put it in the interface and the user carries it. Leave it in the system and the technical team carries it. The work is choosing who can carry it best.
- Validating early removes more friction than simplifying late. The main decisions started from the same place: understanding what was happening before proposing what to change.
- Showing less can help people decide better. We learned it watching adjusters freeze in front of options they didn’t need.
What I’d do differently
We launched everything at once and that delayed the release by several months. Today I’d start with what moved the metric most, the reorganisation of alerts, with a single insurer, and roll out the rest in phases, measuring each one. We’d have had results sooner and would know which change produced each improvement.
Closing
On this project, research changed the brief completely. What looked like an interface problem was a way of working nobody had documented.
Research is what decides whether the project makes sense.