Orange · B2C · 8 min read
Fibre purchase flow · Orange
+7% conversion · ~€2.5M new recurring revenue · Corporate standard
Case study by Vicente Molero, Senior Product Designer.
Overview
Orange · B2C
Several squads. Five versions of the same form. No owner.
The brief was to improve conversion in the fibre purchase flow. Auditing it showed something else: metrics nobody was reviewing, user tests filed away, and an address field built five different ways by squads that had never coordinated. Everything was there, in data nobody had read as a whole.
In 30 seconds
In 30 seconds
- Problem
- Five versions of the address field, each from a different squad, and the real price at the end of the flow. Users dropped out right after filling in their details.
- My role
- Sole UX designer on the squad. I proposed showing the price before asking for details and used data to align the squads on unifying the address field.
- Result
- +7% conversion in the flow, measured in production, and the standard for Orange’s entire commercial website.
- Role
- Product Designer · UX Architect · sole UX designer on the squad
- Year
- 2020
- Duration
- 3 months
- Team
- 1 PM · 1 front-end-oriented UI designer
- Context
- Online fibre purchase flow for new customers. B2C product in production at one of Spain’s three largest telcos, with analytics available and no systematic process to use them.
Impact
- +7% Flow conversion — Concentrated in the final steps. Measured in production by Orange; Orange’s base rate isn’t public; for the estimate I use ~2.5%, typical for the industry.
- ~€2.5M New recurring revenue — Conservative estimate: ~200,000 visits a month, ~2.5% base conversion and ~€600 average yearly revenue per customer (about €50 a month). The +7% means ~350 more contracts a month, about 4,200 new customers a year.
- 1 squad → all of Orange Corporate standard — The flow and the unified address component became the reference for the whole commercial site.
A note on the financial figures: the ~€2.5M is a conservative estimate based on public data from Orange Spain and industry benchmarks. It is not an internal figure published by Orange.
“Vicente didn’t stop at the screens: he understood the business, proposed what to measure and defended his decisions with data. He’s the designer you want at the table when it’s time to decide.”
The problem
I joined as the squad’s only UX designer and, before designing, I started reading. I audited the whole flow in production, the available metrics and the user tests from previous months. The information existed, but it was disconnected.
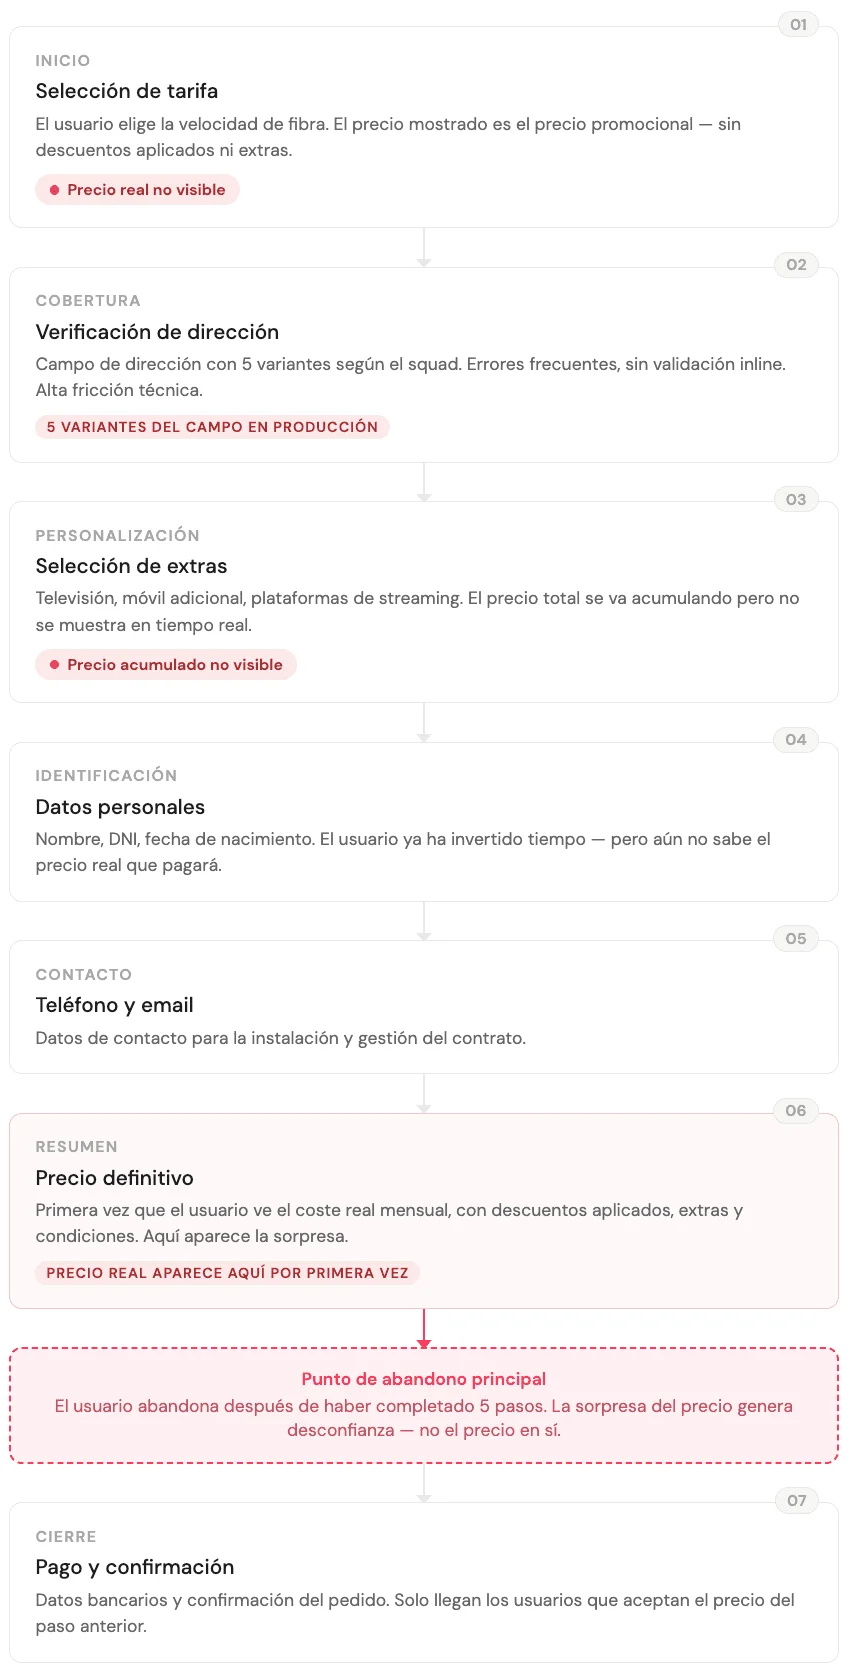
Orange is a large corporation. Every squad had its own tools, its own analytics, its own inherited patterns. The accumulated result was a purchase flow with disorganised forms, steps mixed together that should have been separate, and five variants of the address selector, the most critical field in the process, built independently by teams that had never coordinated.
The drop-off data showed users leaving at the end of the flow, after investing time and filling in their details. The real price appeared too late.
It was a flow architecture problem, and it had been visible in the data for a while.
Research
Before defining any solution, we needed two things: to know how real users behaved in the flow, and to understand where we stood against the competition.
- Qualitative research with an external agency. We commissioned the interviews from an external agency specialising in user research. Eight sessions with people who had signed up, or tried to sign up, for fibre online in the previous six months, with a mix of ages, digital experience and previous provider. We wanted to see the flow without bias before touching it.
I thought the price I was seeing was the final one. When I got to the summary it was different. I didn’t trust it anymore.
- Functional benchmark of 15+ providers. We analysed the sign-up flow of more than fifteen national and international telcos. We looked at how they worked: when does the price appear? How many steps does the checkout have? How do they ask for the address? Is there a real-time calculator?
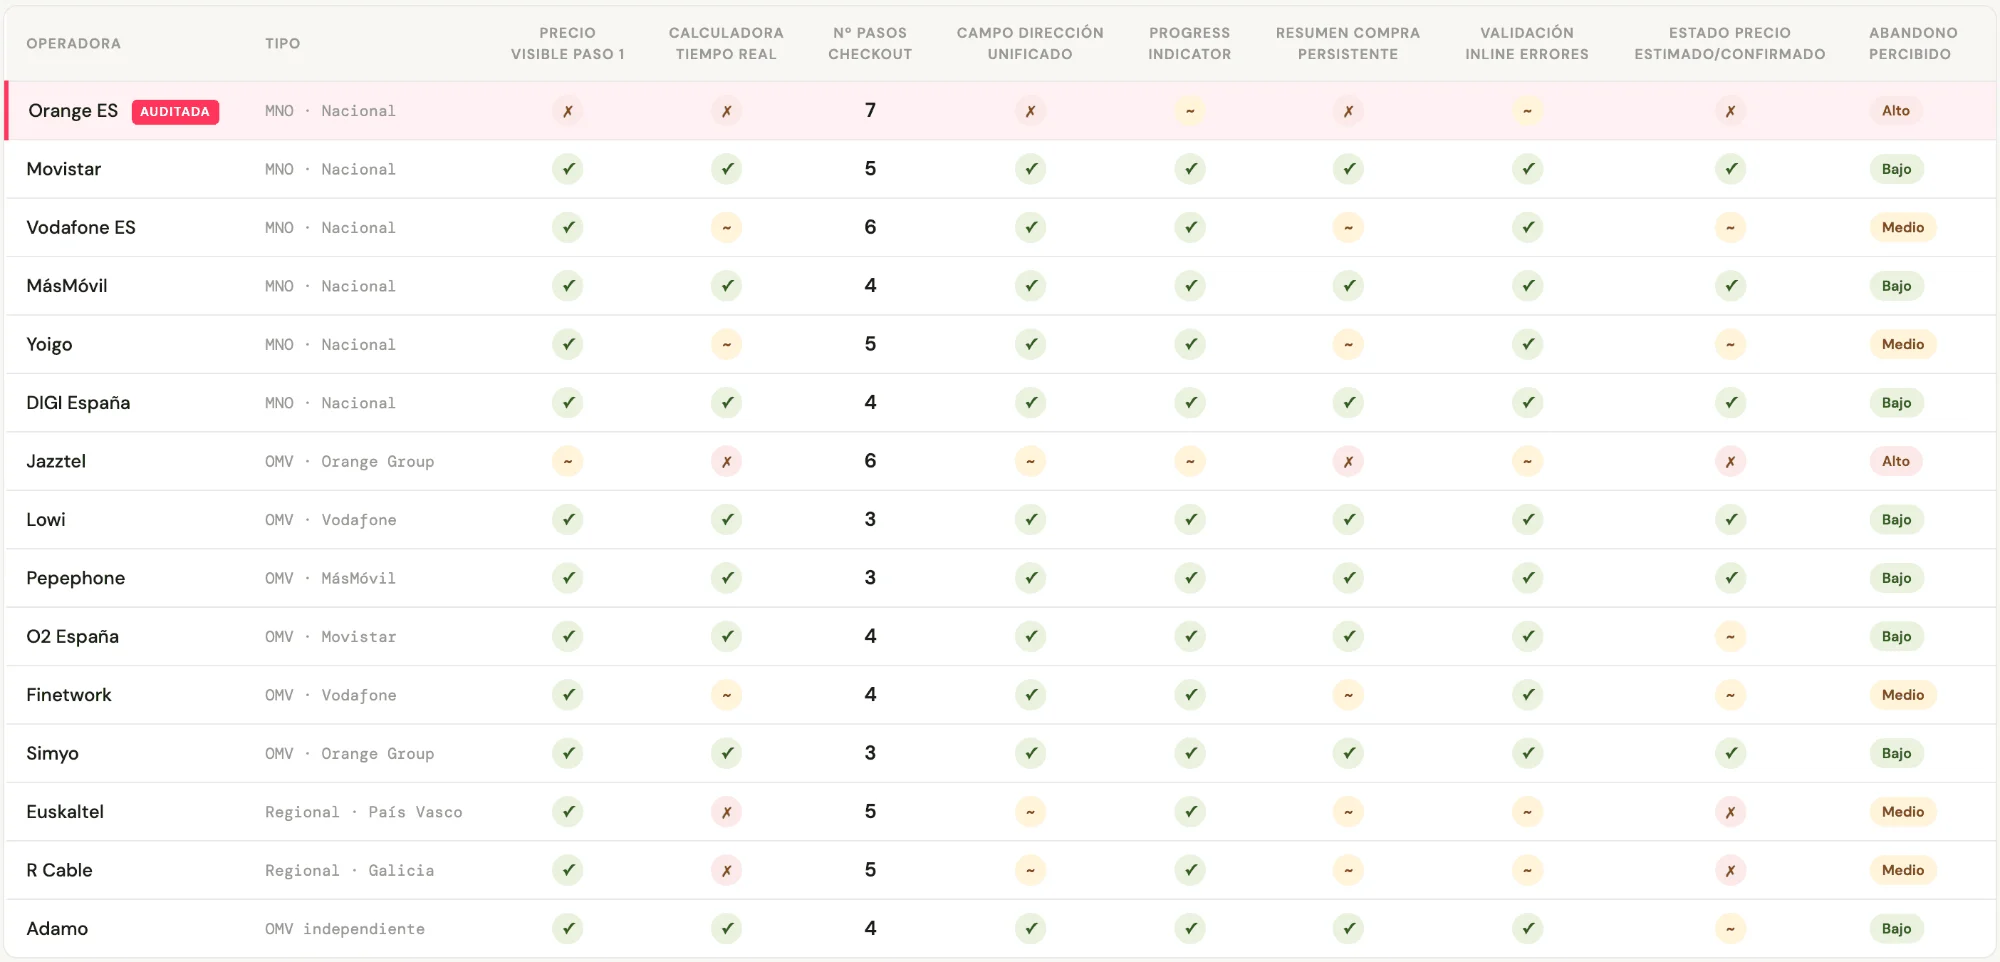
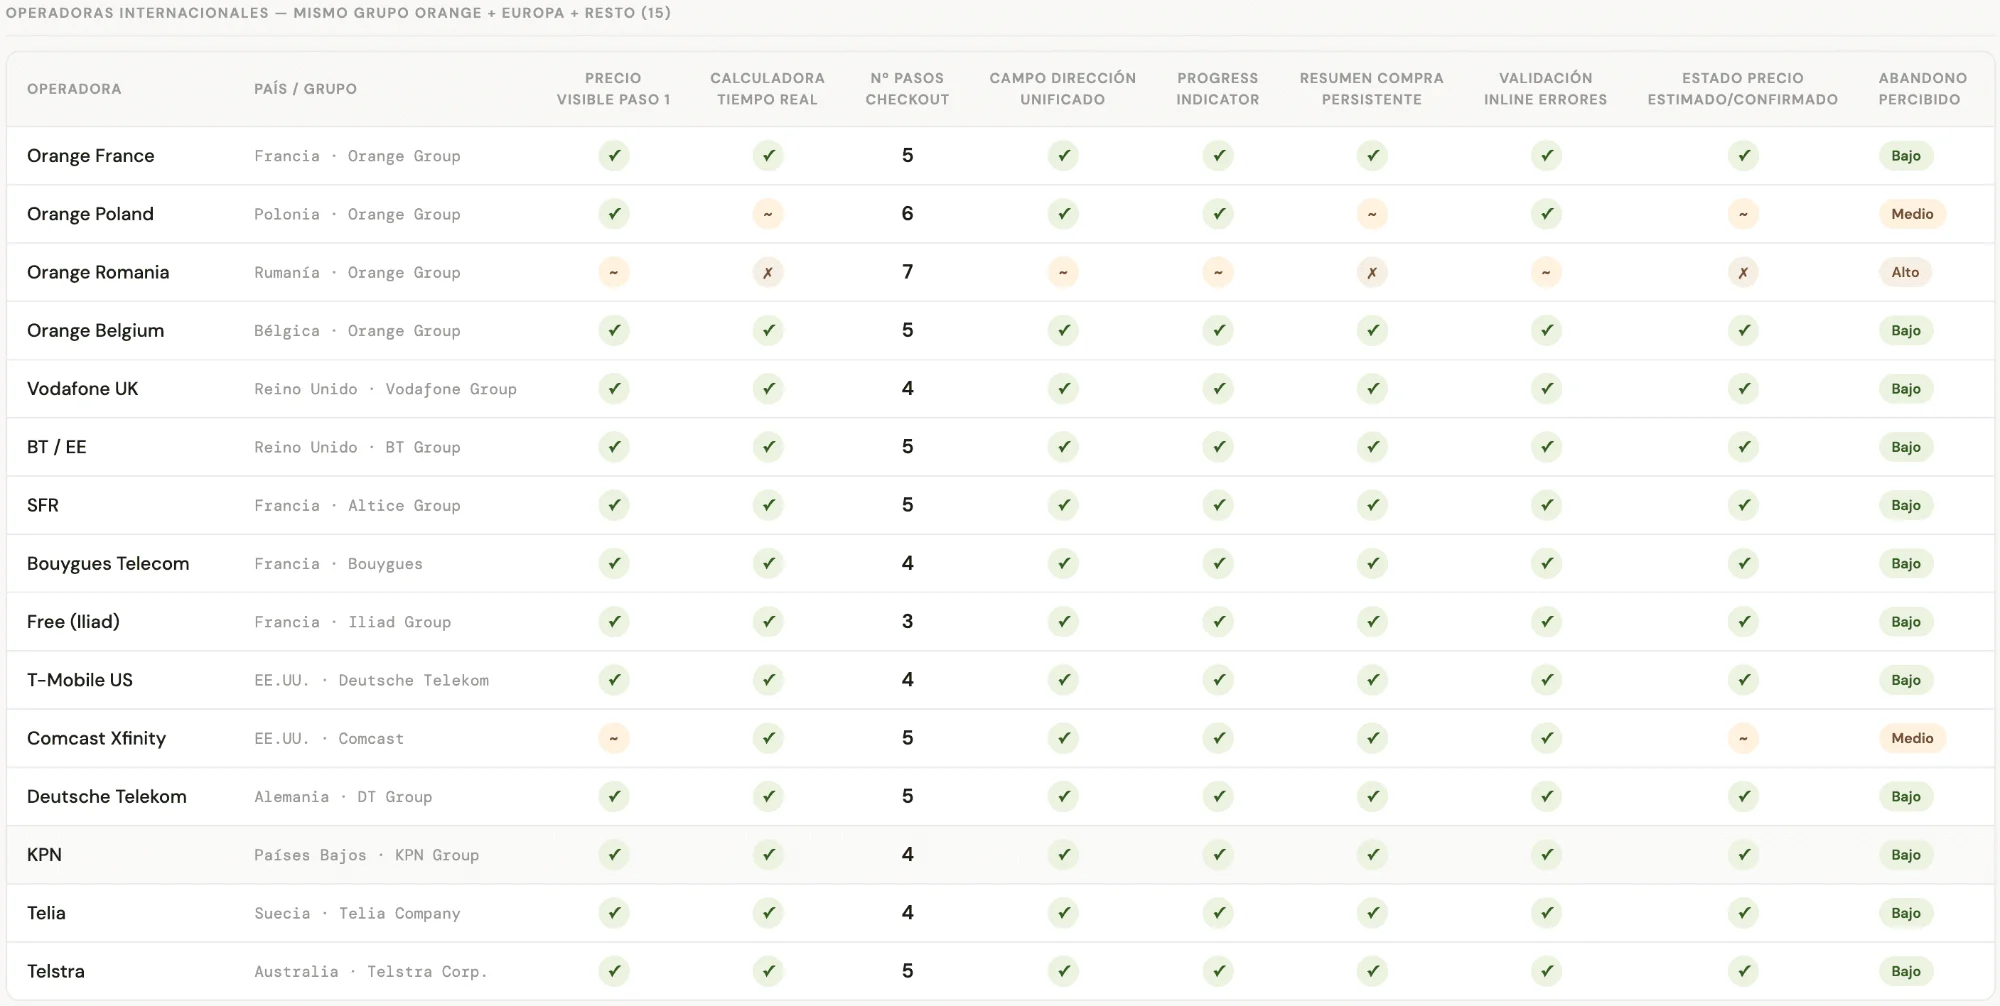
The pattern was consistent: no provider with low drop-off hid the price until the end. Orange Spain was the only one of the fifteen analysed that didn’t show a price until the personal details were complete. The research explained it through behaviour. The benchmark confirmed it through the competition. With both sources, the hypothesis became a solid argument for the product team.
The flow followed the order in which the company collected data. The buyer needed a different one.
Decisions
Three decisions, and the most important one was made outside Figma.
Convincing several squads they had the same problem
The hardest decision of the project was made in a meeting. There were five variants of the address selector in production and each squad owned its own. None saw it as their problem, because their variant, on its own, “worked”. You could only see it from outside a single squad. My argument was the data: the error rate on the address field was among the highest in the flow, and it was where most users dropped out because of technical friction.
With that on the table, the conversation changed: we were no longer talking about design taste, but about a variant that was costing contracts and that we could measure.
Result: The standardised component was adopted as the reference pattern for Orange’s entire commercial site. The negotiation took longer than the design.
Showing the price before asking for details
The original architecture followed a data-collection logic: name, ID, contact details and, at the end, the final price. The argument for keeping it was a business one: “if users see the real price earlier, they may leave without giving us their details”.
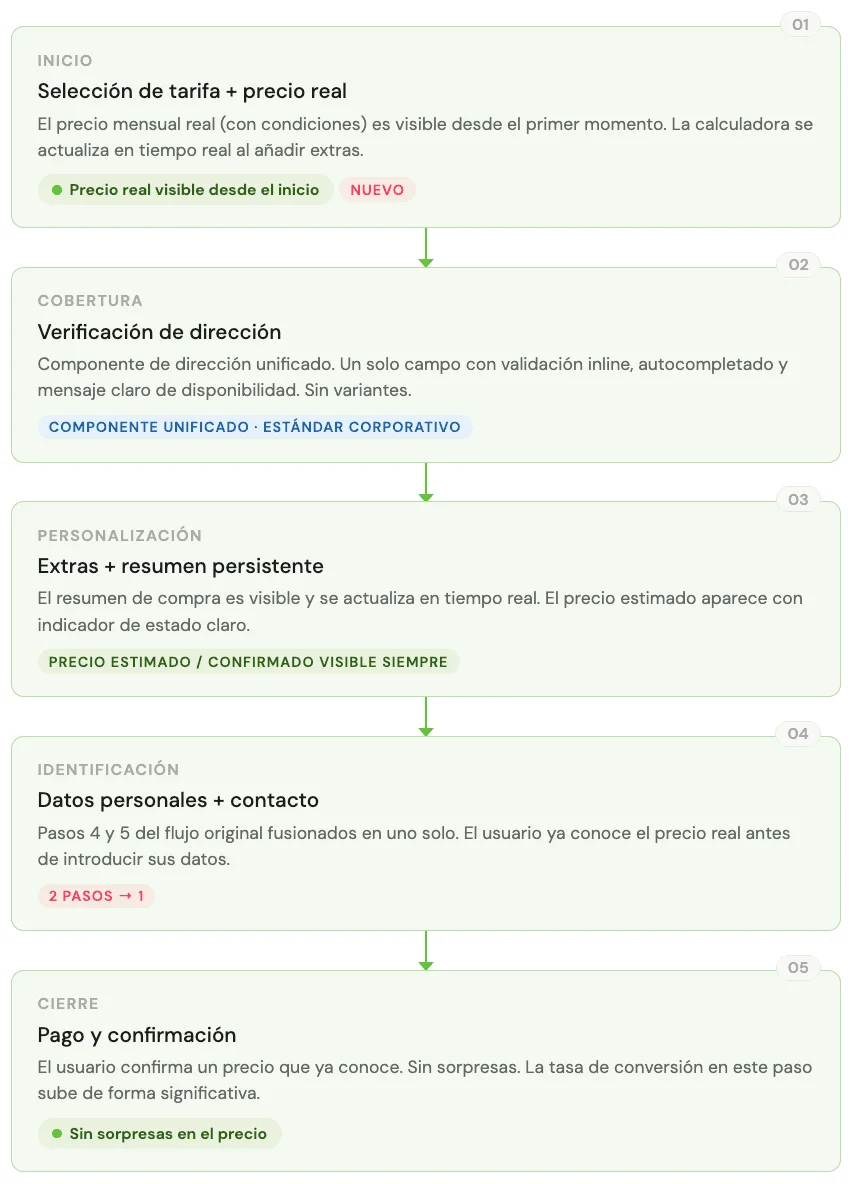
My argument was the opposite: if they leave at the end, we’ve burned their time, ours, and a session that marketing data counts as qualified interest. The drop in the final steps was evidence that this was already happening, at scale, every day. The research said it clearly: users were more bothered by the surprise than by the price.
I proposed reorganising the flow so the monthly cost calculator was visible from the moment a plan was selected, updating in real time with the extras chosen.
Result: Drop-off in the final steps fell visibly. It was the most counter-intuitive change for the business and the most predictable for the user.
Introducing process where there was none
The first time I presented wireframes before moving to UI, the PM asked whether “that extra step” was necessary. The UI team was used to receiving finished screens, not architecture. The change wasn’t welcome at first.
What changed the dynamic was the first real handoff with specified behaviour. For the first time, the development team received a document with defined states, error flows and component logic. The feedback was direct: it was the first time they didn’t have to assume behaviour on their own. No open questions were left in implementation, and no design decisions were made in code.
Result: That was enough for the process to stop being “how this designer works” and become the reference for Orange’s commercial web design.
My product role
I was the only UX designer on the squad, so the proposal to show the price before asking for details was mine, and so was the argument to defend it: the qualitative research, the benchmark of fifteen operators and the drop-off data. The hardest part wasn’t designing it, but getting the business to accept showing the price before having the user’s details. With the address field I did the same: I took the error data to the squads so they could see that their variant, on its own, was costing contracts.
What remained after the +7%
The brief was to improve conversion in the fibre flow. That happened, but the most lasting impact came from elsewhere.
- The flow became a corporate standard. Orange runs multiple commercial products online. When the team showed that a structured process produced measurable results, management decided to apply it as the reference for the rest of the commercial site. One squad’s work became everyone’s method.
- The unified address component permanently reduced accumulated debt. Five variants in production means five implementations to maintain, five possible sources of errors, five different friction points depending on where the user came in. A single, well-built implementation removes the problem at the root.
- The data got an owner. The analytics and user tests existed before I arrived. What didn’t exist was someone reading them systematically before designing. Part of the process we left behind was never starting a design cycle without first reviewing the available data.
Process
With the audit and research as a foundation, we worked in phases. Validation with 22 users on clickable prototypes confirmed the central hypothesis (seeing the price from the start reduced anxiety when deciding) and revealed an unexpected problem: some users took the calculator as the final price before confirming coverage, and got frustrated when availability changed the amount. We had to communicate the state of the price better.
We solved it with an explicit “estimated / confirmed” price indicator, visible and persistent throughout the flow. A small copy and state change that removed a source of confusion that wasn’t in any brief and only appeared when we put the prototype in front of real users.
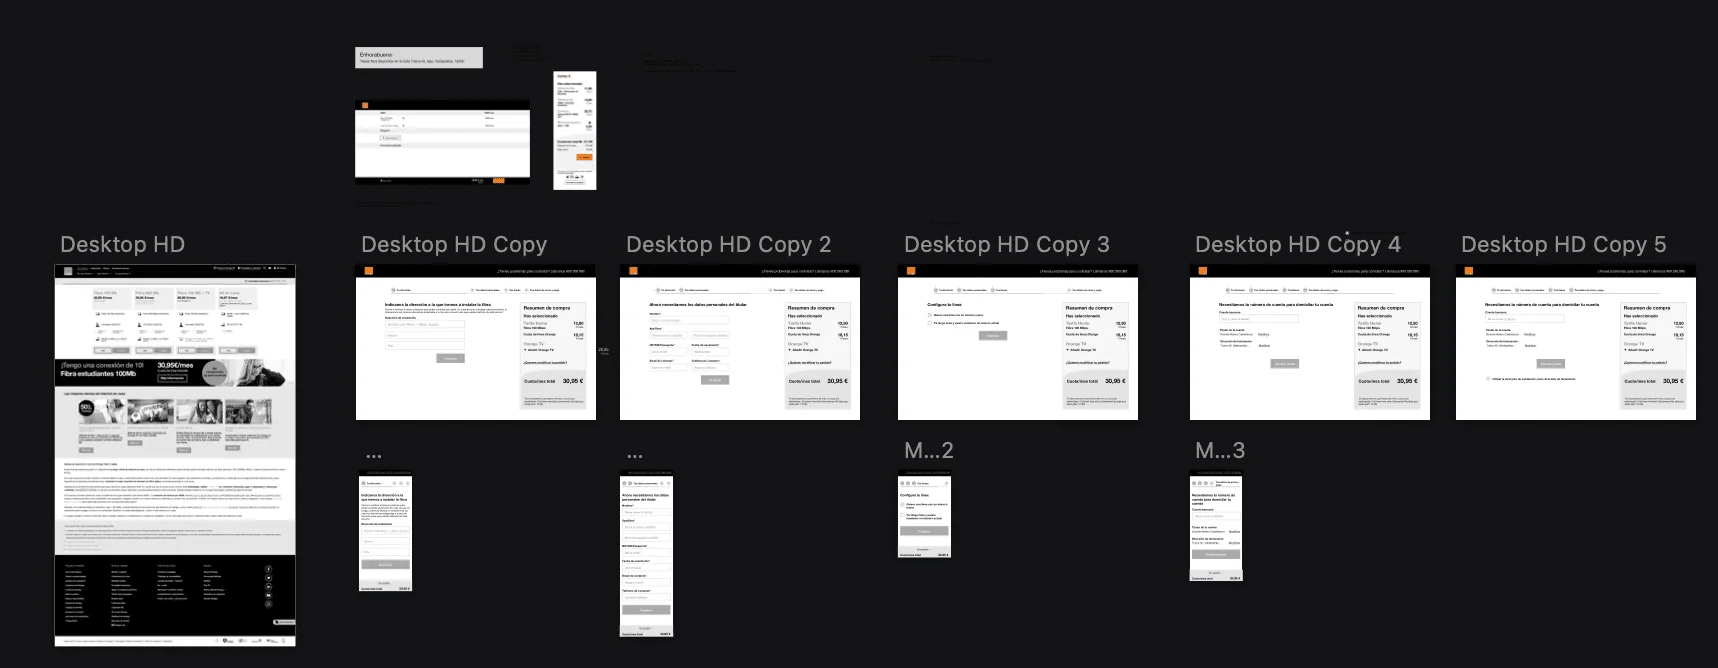
- Audit of the flow in production + analysis of drop-off metrics per step
- Qualitative research with an external agency: 8 sessions with real users
- Functional benchmark of 15+ national and international providers
- Information architecture ordered around how the user decides
- Wireframes and clickable prototype
- Validation with 22 users + adjustment of the estimated / confirmed price state
- Handoff to the UI team + definition of the unified address component as a corporate standard
What I’d do differently
I’d check coverage earlier. Validation showed that the price changed when coverage was confirmed, and that this frustrated people. We solved it with the estimated / confirmed indicator, but today I’d ask for the address before showing the calculator, so the first price the user sees is already the real one.
And I’d bring the squads in from the start. I convinced them with data in a meeting. Today I’d involve them from the audit, so the problem was theirs from the beginning and not an argument of mine.
Closing
On this project, the answer was in data everyone had and nobody had read as a whole.
In a large organisation, designing well also means knowing where the information is, who owns each piece and how to build the argument that aligns different teams.